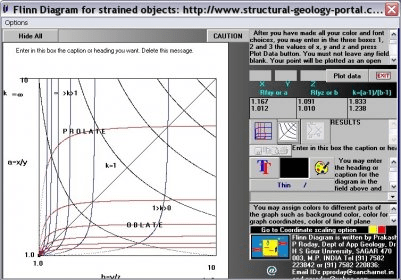
Flinn Diagram is a small but useful application that basically allows you to plot diagrams for constant volume deformation used in Structural geology.
The program has two plotting options: "Plot directly points by mouse" and "Plot the data". The first option allows you to move the mouse up or down the graph, and as you move it the values of a, b and k are automatically updated; the mean value is displayed if you click on any point of the graph - you can enter the highest values of x/y or y/z to facilitate the scaling. The second option is more customizable, it allows you to type the X, Y, and Z values to obtain the a, b, and k values. After the a, b, and k values are calculated the point is plotted (you can customize the color of the potted point). You can also plot the Vx and Vz curves, and the a,b curves.
If you want to plot new values, you have to restart the program. You can enter a header for the plot, and adjust its color and font. You can only save the plot as a BMP image or print the plot with the "Plot the data" plotting option. A preview window can be also used before printing. You can also switch between the two plotting options at any time.
Comments